Diagnostic options
The internal CNC schedule can be logged to diagnose MultiCore functions. This can take place at different times or interactions:
- automatically at CNC start-up
- implicitly on storing/requesting CNC diagnostic data
- by writing a CNC object
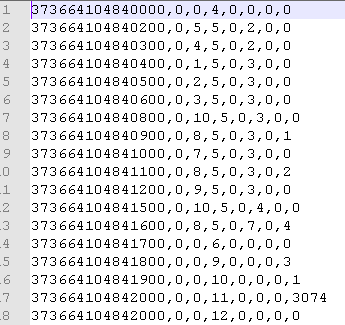
Logging first takes place in an internal logging format. Logging is then prepared in a subsequent step into a suitable representation (text format, view).

Controller start-up
For controller start-up, the logging time can be set using P-STUP-00213 of the schedule events. Logging is deactivated with a value=0 (default).
Events are logged to the text file specified in P-STUP-00214.
Example

Parameterisation example for diagnosing MultiCore events in the start-up list
#
# *******************************************
# TC_STARTUP_DESC: TwinCAT CNC configuration
# *******************************************
task_trace.geo.max_records 2000
task_trace.geo.filename multicore-startup.log
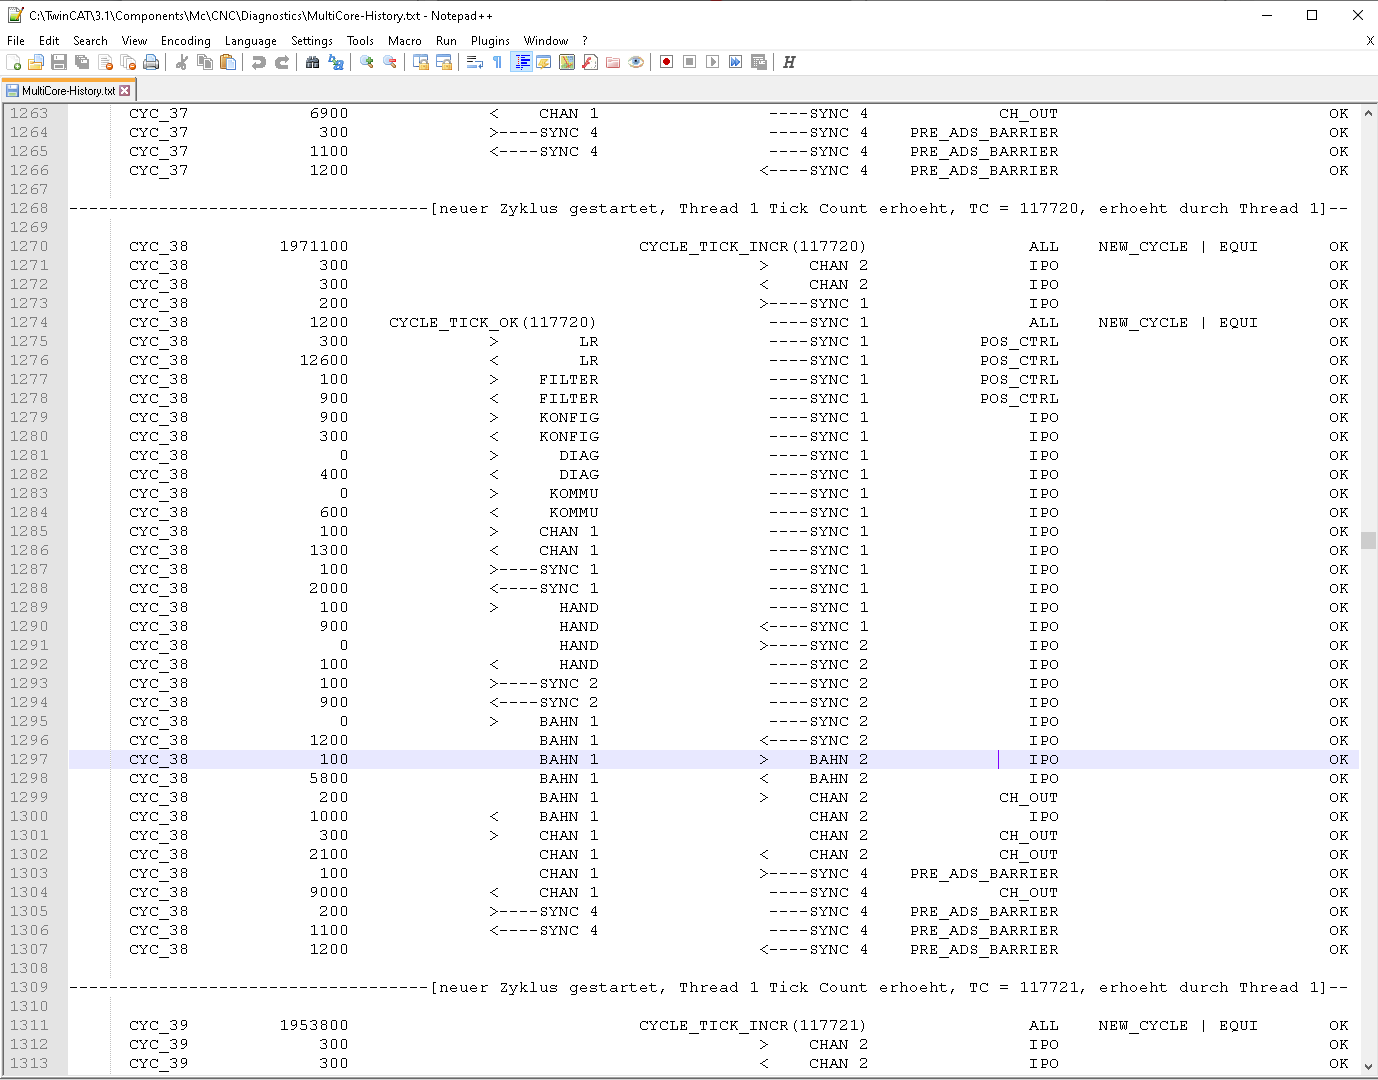
task_trace.geo.history_filename multicore-history.log
#
Logging in diagnostic data
When CNC diagnostic data is requested, the past log entries of the schedule (history) are output automatically. The length of the logging time is specified as a fixed value. The name of the output file can be modified using the start-up parameter P-STUP-00215
Using CNC objects
The following CNC objects are available for diagnostic purposes:
- ttrace: max., this parameter can be used to set the maximum number of logs, analogous to P-STUP-00213
- ttrace: act.
- ttrace: filename, analogous to P-STUP-00214
- ttrace: history filename, analogous to P-STUP-00215
- ttrace: layout written
- ttrace: append to file
Example of outputs
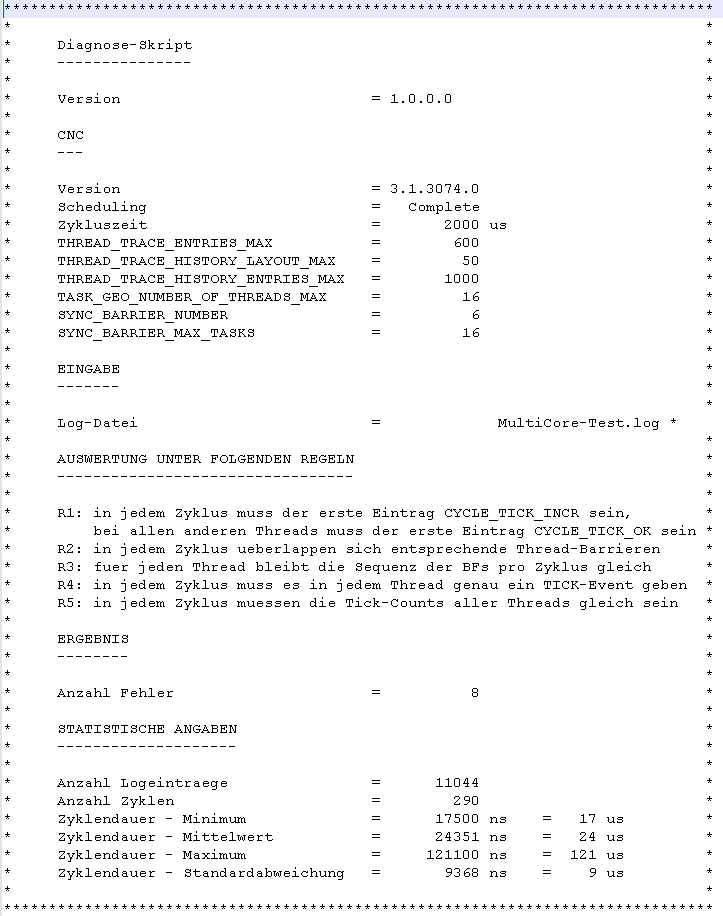
The output format, e.g. the MultiCore-Startup.log, looks like this:
The representations below are produced by an internal tool to prepare the above output format.
Each MultiCore log file contains internal context information at the start, such as version number, schedule type, cycle times, etc., which make it easier to diagnose error response.